At FreeForm we always start with the overall goals of our clients, these are often measured by metrics that lags behind our daily work. For example, we want to maximise the total volume of orders that goes through ecommerce portals, but this is not a very action oriented goal as these are difficult to influence in the short term. Instead, we try to break down the lag measures into ‘lead’ metrics.
These metrics can for example be number of blog posts written, number of opportunities added in Salesforce, response time to support tickets, or other metrics that employees can influence on a day-to-day basis. So we start out with the big overall metrics, as they are of interest from a business intelligence perspective, and then we break them down to more useful metrics that we can act on on a day-to-day basis.
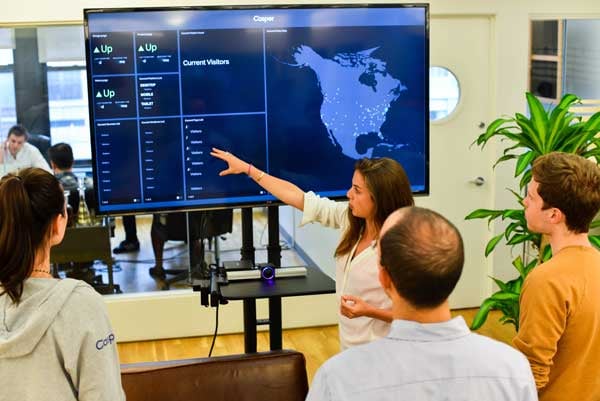
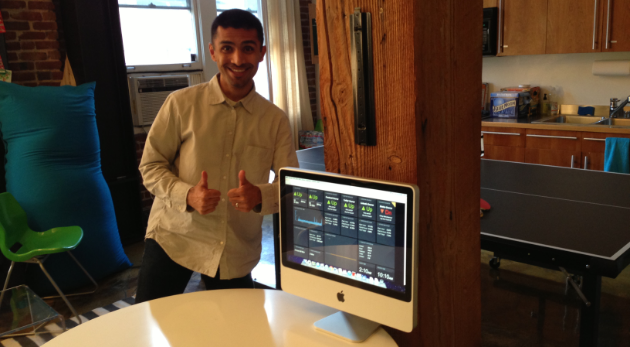
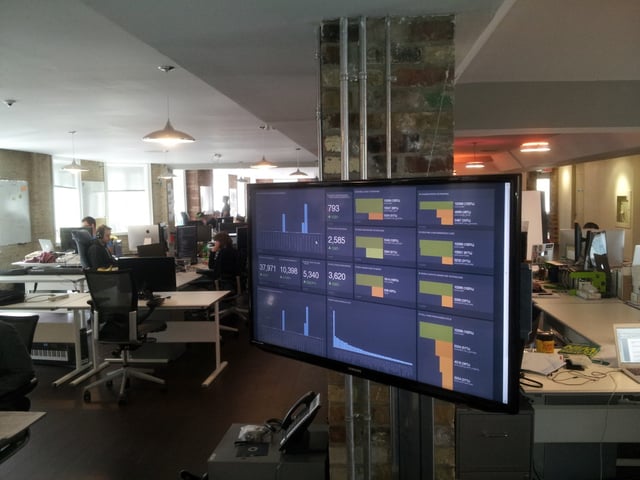
FreeForm’s digital dashboards brings KPIs and critical metrics into an artfully designed and intuitive display with information streams updated in real-time. Our dashboards can coalesce critical information from several tools at once so we can monitor all of our clients most important data in one place and track progress, whether we’re focusing on the performance of a mailing list, ad campaigns or content marketing efforts. Not only do FreeForm’s dashboards look cool, they keep everyone on the same page. The dashboard publicly displays all important data in real time, so every department has access to the information it needs to better collaborate.

FreeForm dashboards utilises data visualisation to display a combination of company metrics, and by using an API we can integrate accounting software, sales spreadsheets, customer relationship management (CRM) systems, email, website analytics and other systems into the FreeForm dashboard display.
“A data dashboard allows you to move in an agile way as a young company when you’re experimenting with a lot of different things,” says J. Scott Zimmerman, founder and CEO at Xola, a company that provides booking and marketing systems for tours and activity companies. “We set goals and have real-time feedback.”
FreeForm dashboards are fluid to assist in the management of information. Through data visualisation, you can view sales, downloads, reviews and rankings. The dashboard also allows our customers to monitor their customer feedback, staff goals and control servers from multiple providers to get real-time alerts. Studies show that when employees know their performance is being watched publicly, they improve their work.

“Being able to have graphs and other data updating live on screens around the office is invaluable in spotting changes in trends and picking up on issues before they become a problem,” says Adrian Sevitz, CTO at Vzaar, which provides video hosting platforms.
Prior to FreeForm Client Dashboards our clients used other solutions, but most were discontinued (metricly). FreeForm has always been very keen on communicating the metrics with our clients, but until they use our dash view they struggled to find the right solution.

Most marketing companies are stuck on the ideas of yesterday. We at FreeForm focus on the ideas of tomorrow—to revolutionize today and go head-to-head with innovation at its finest. Our approach: design thinking. Think. Feel. Do. Through desirability, feasibility, and viability, we redesign the idea of innovation and, through it, rediscover the world through a new lens.


